Laurie Bassi and Dan McMurrer
McBassi & Company
September 2019
Introduction
The areas where PEOs can deliver significant value to their clients can be divided into three broad categories:
- Improving clients’ ability to attract, motivate, and retain employees;
- Enabling clients to focus on their core businesses while PEOs handle all HR matters; and
- Lowering HR-related expenditures
The first two categories have been addressed in NAPEO’s previous white papers. Those papers found a wide array of positive differences between PEO clients and their non-PEO counterparts in business success, employee-related measures, and other factors.
For example, in category 1, we found that PEOs offer a much broader array of benefits to their employees, such as greater access to retirement plans. Consistent with this, we found PEO clients also have significantly higher employee satisfaction as well as lower rates of employee turnover. In category 2, our analysis found PEO clients grow faster and are much more likely to stay in business than other companies. Further, their employees are more likely to describe the business as innovative and taking the right steps to be competitive.
Therefore, in the 2019 white paper, we focused our research on category 3 in an effort to fill in some details about that remaining piece of the PEO value equation. Specifically, if we look only at cost savings (leaving all other PEO-related benefits to the side), what sort of return could the average client expect on its PEO investment?(1)
Although it is only one component of the overall value delivered by PEOs, it is still one of the most basic questions prospective clients have when deciding whether to use a PEO—will they experience sufficient cost savings to generate a positive return on their investment? The research summarized here indicates that a conservative estimate of the expected ROI for PEO clients—based on cost savings alone—is 27.2 percent per year. This ROI estimate is almost certainly an underestimate and is based only on cost savings (it does not incorporate the important benefits noted above in categories 1 and 2).
The 27.2 percent estimate is based on calculating cost savings for PEO clients in the following five HR-related areas:
- HR personnel costs;
- Health benefits;
- Workers’ compensation;
- Unemployment insurance (UI); and
- Other external expenditures in areas related directly to HR services (payroll services, benefits, etc.)
What Does an ROI of 27.2% Mean?
Return on investment (ROI) is the net benefit of an investment divided by the cost of the investment. Cost is the key element in almost all ROI calculations. This is because the cost savings are much more tangible and hence more readily quantifiable than value (benefits) created. As a result, most analytically-responsible ROI estimates tend to underestimate the true value of an investment (as is the case here).
For a PEO client, the net cost savings benefit of hiring a PEO is equal to the savings that the client experiences as a result of using a PEO minus the cost of being a PEO client. Dividing that by cost yields ROI. We calculated clients’ savings based on five different categories of HR-related costs and compared them to the average cost of being a PEO client (PEOs’ average gross profit per WSE from NAPEO’s 2018 Financial Ratio & Operating Statistics (FROS) Survey data). By far, the most significant savings that clients experience from using PEOs are in the areas of HR personnel costs and health benefits costs.
An ROI of 27.2 percent means that for every $1,000 spent on PEO services, an average client would save $1,272, yielding a net (cost savings) benefit of $272 for every $1,000 spent. It is important to understand that the calculated ROI is an average drawn from all PEO clients in our research database. This means that roughly half of prospective clients would be expected to have an ROI greater than 27.2 percent, while half would be expected to have an ROI lower than that. Prospective clients most likely to have ROIs even higher than 27.2 percent are those that have above average HR personnel costs and/or above-average health benefits costs per employee. It’s worth noting again that this ROI is based only on cost savings and does not incorporate the important benefits derived from improving clients’ ability to attract, motivate, and retain employees and enabling clients to focus on their core businesses, as documented in our prior research.
How We Did The Research
We offered organizations (both PEO clients and organizations that do not use PEOs) a free employee survey. To take advantage of this offer, each participating organization was required to complete a detailed enrollment form that included a variety of measures that could be used for purposes of our research comparing PEO clients to benchmarks for other organizations on HR-related expenditures as well as a variety of other factors we also included in the enrollment form. The cost-based comparison served as the basis for the ROI estimate noted above.
A total of 132 PEO clients (represented by at least 10 different PEOs) submitted data as part of this survey/research initiative. We also received data from 44 organizations that are not PEO clients.
Full details about our research methods are included in the Methodology section at the end of this paper.
How ROI Was Calculated
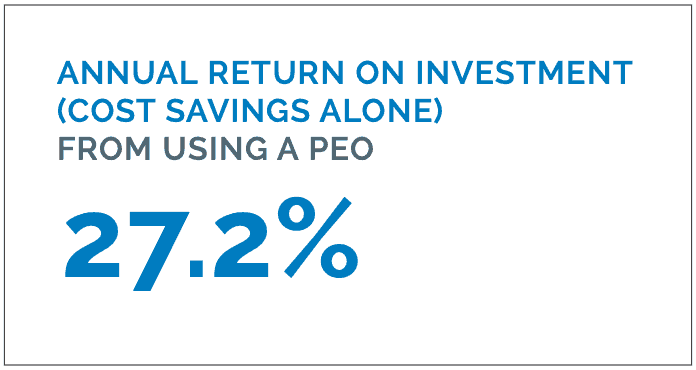
The estimated ROI of 27.2 percent per year was derived by calculating PEO-related cost savings per employee (FTE) from the five expenditure categories noted above and comparing it with PEO-related costs per worksite employee (WSE) from the 2018 NAPEO Financial Ratio & Operating Statistics Survey. The average cost savings from using a PEO is $1,775 per year per employee, while the average PEO cost per employee (gross profit per WSE in the FROS) is $1,395, yielding an annual ROI of 27.2 percent.(2)
By percentage, using a PEO results in the savings included in Figure 1 (all measured on a per FTE basis).
Savings on internal HR employees’ salaries/benefits was determined by comparing the number of HR FTEs among PEO clients (mean of 1.6 FTEs per 100 employees based on data we gathered through the research initiative) to the mean number of HR FTEs (2.6 per 100 employees) among businesses as a whole (based on a large survey of businesses conducted by the Society for Human Resources Management (SHRM) in 2017) and applying Glassdoor data for average HR salary/benefits in small businesses.
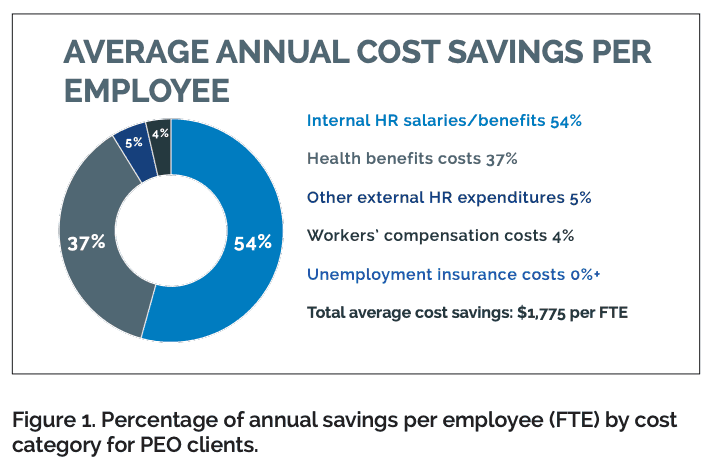
Savings in the three remaining categories—health benefits, workers’ compensation, and unemployment insurance—were calculated using questions from the enrollment form (using data from new PEO clients only). Respondents were asked how organizational costs in those categories had changed since starting to use a PEO (see Figure 2 for percentages of businesses reporting changes in costs). They were also asked to provide the exact amount of the difference in costs, if they had that information available. Respondents provided sufficient data to determine exact savings for health benefits(3) and workers’ compensation, but not unemployment insurance.(4) On the health benefits front in particular, it is important to note that, on average, PEOs are also able to provide a wider range of health benefits options to their clients, a benefit that is not reflected when focusing solely on cost savings.
Savings in other HR expenditures were calculated using enrollment data for this research project, comparing reported external HR expenditures between non-PEO businesses and their closest comparison (determined by industry and size) business among PEO clients.
Additional Sources of Value PEOs Deliver to Their Clients
Enrollment submissions provided additional data that we used to complement research reported in previous NAPEO white papers on the first two categories of PEOrelated value described at the beginning of this paper (attracting/motivating/retaining employees and enabling clients to focus on driving core business success).
In many cases, we were able to use the 2019 enrollment information as an additional source of data on key value areas we had examined previously when using different data sources. Every time major findings are confirmed by different data sources, comparisons, or analytic techniques, the findings can be considered more solid and more definitive. Thus, we viewed the enrollment data as an excellent opportunity to re-examine previous areas of our NAPEO white paper research.
Additional Sources of Value
In particular, our 2019 analysis revealed the following four important findings:(5)
- There is notably lower employee turnover (both voluntary and involuntary) among PEO clients;
- There are higher rates of both employee growth and business revenue growth among PEO clients;
- Fewer PEO clients expressed moderate or major concern about hiring, retaining, and motivating employees; and
- New PEO clients often add a variety of new benefits for their employees, with life insurance, retirement plans, and health benefits the categories most frequently added by new PEO clients.
Lower Employee Turnover
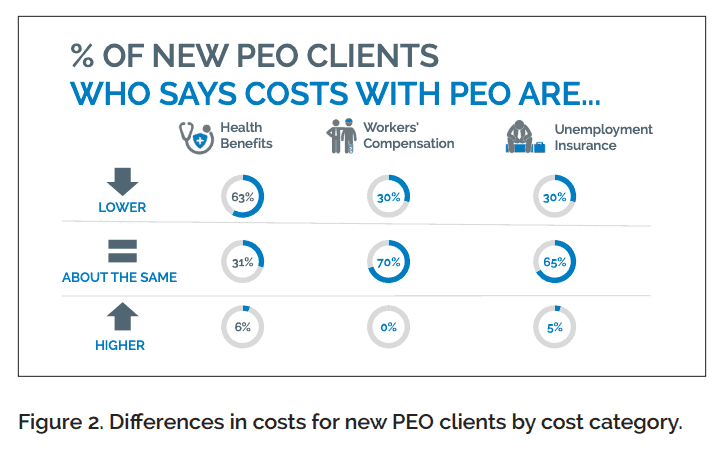
We compared voluntary and involuntary employee turnover between PEO clients and national averages for all non-governmental employers from the Bureau of Labor Statistics (BLS). We found significantly lower employee turnover among PEO clients. Combining voluntary and involuntary departures, total employee turnover among PEO clients was almost 20 percentage points lower than turnover nationally. Exact breakdowns are included in Figure 3.
Higher Rates of Growth
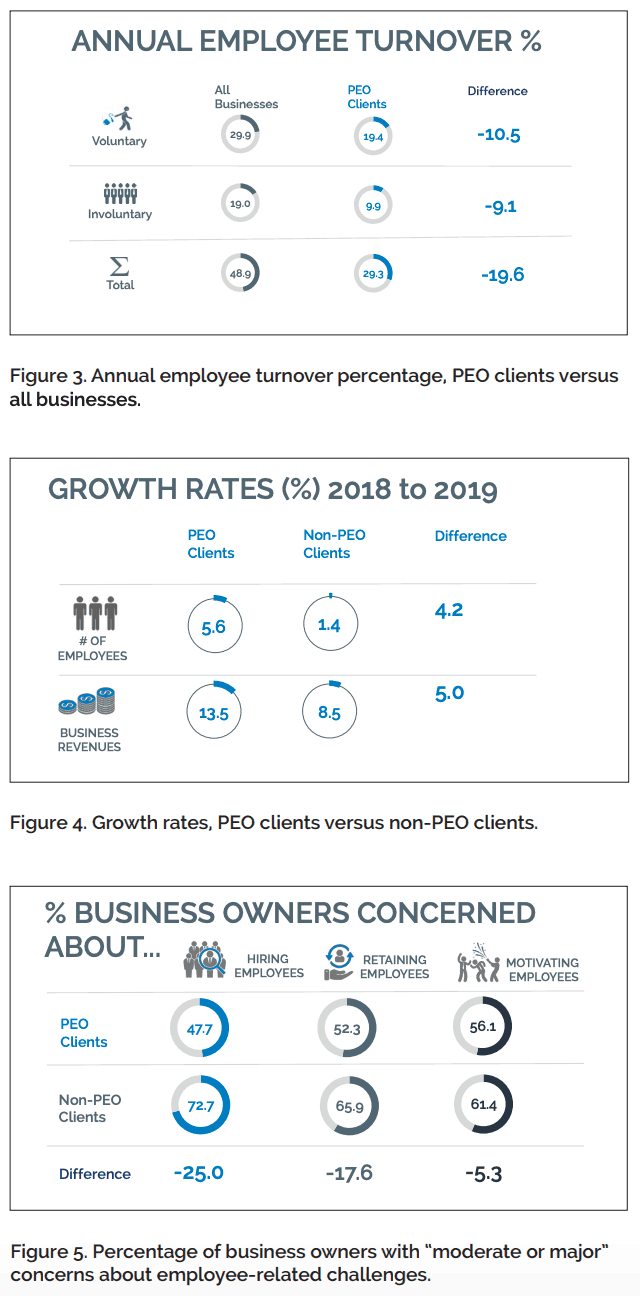
We compared 2018 to 2019 growth rates in actual number of employees and in expected change in business revenues and found notably higher growth rates for PEO clients versus non-PEO clients. Detailed results are included in Figure 4.
Fewer Concerns About Employee Challenges We asked respondents in the enrollment process about whether they had “moderate or major” concerns about a wide range of different potential business challenges. Only three categories were identified as concerns by more than half of all respondents: those related to hiring, retaining, and motivating employees. See Figure 5.
For each of these challenges, fewer PEO clients expressed concern than non-PEO clients, with a particularly notable difference in concerns about hiring employees (a 25 percentage point difference; 72.7 percent of non-PEO clients versus 47.7 percent of PEO clients).
Employee Benefits Added by New PEO Clients
We were also able to use the research database to determine which types of employee benefits were most frequently added when an organization began working with a PEO. Life insurance, retirement plans, and health benefits were the three most frequently added, with exact numbers provided in Figure 6.
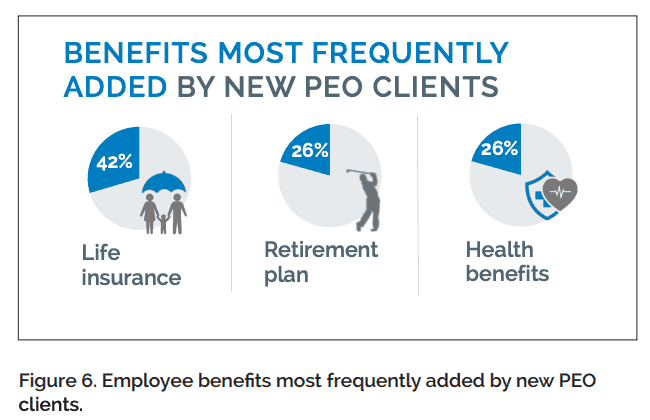
Although this does not directly compare PEO clients and non-PEO clients, it does provide another example of an advantage that accrues to PEO clients.
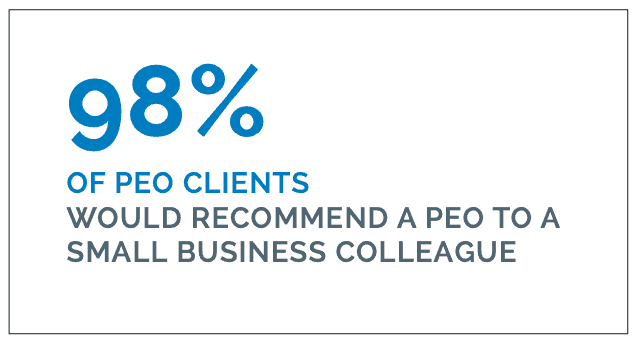
Finally, the survey enrollment form also asked PEO clients whether they would recommend a PEO to a small business colleague. In a finding that mirrors a result from NAPEO’s 2017 white paper, 98 percent of all PEO clients responded affirmatively that they would recommend a PEO.
Summing Up: Implications for PEOs
Findings from previous NAPEO white papers had pointed to the significant value that PEOs deliver to their clients in helping to attract/motivate/retain employees and deliver better business results. Many of those findings were confirmed using new data from this analysis. Most importantly, however, this year’s analysis helped to fill in an important missing gap in the PEO value equation—cost savings.
This year’s research found that the cost savings ROI on a PEO investment is conservatively 27.2 percent per year.
The cost savings framework provided in this white paper can serve as the foundation for PEOs to create their own, customized ROI calculators (incorporating their own costs as well as clients’ actual costs). This would serve as an excellent tool to help prospective clients quickly understand the cost-related benefits they would experience by working with that PEO.
In sorting through implications for PEOs’ business development efforts and other strategic considerations, it is important to keep in mind that the ROI reported here is an average. As mentioned in the box on page 2, roughly half of all prospective clients would be expected to have a cost savings ROI higher than the average of 27.2 percent (and correspondingly, roughly half would also be expected to have lower ROIs).
From a cost-savings perspective, to the extent that it’s possible to target potential clients with higher-than-average ROIs, business development efforts are likely to be more successful. In particular, it would make sense to seek prospective clients that have higher-than-average costs in one (or both) of the two categories of HR-related expenses where PEOs can typically deliver the biggest savings: HR personnel costs and health benefits costs. These are the organizations that would experience the largest ROI from being PEO clients.
Similarly, businesses with higher-than-average employee turnover (or those that have difficulty attracting or motivating their employees) as well as those that struggle to focus on their core business operations also represent good targets for business development, based on findings from both this year’s and previous years’ research results. The businesses that can derive maximum value from PEO services, of course, are those that have more than one of the characteristics described above.
Methodology Appendix
Analysis Sample
This project (like the NAPEO 2017 white paper) was built around the provision of a free employee survey to small- and mid-sized businesses if they provided detailed business-level data that we would use for research purposes. For purposes of this project, we asked interested businesses to provide information about the functioning of their businesses (including HR-related costs, how HR work is done, trends in financial results, number of employees, business concerns, etc.). All organizations that completed the enrollment form were provided with a free employee survey and free benchmarking, available to use at any time during calendar year 2019.
We used a variety of methods to make the employee survey offer available to businesses. PEOs represented the primary vehicle for distributing the offer (most making the offer available widely to any clients who expressed interest, as well as some prospective clients and other business contacts). PEO outreach efforts were complemented by additional offers sent directly to businesses by McBassi or other partner organizations. At least 14 different organizations (PEOs, partners, etc.) generated one or more participating business for this research project. Outreach and business enrollment ran from April to July 2019.
These efforts to enroll businesses yielded a research data sample of 176 organizations. This includes 132 PEO clients and 44 businesses that do not use PEOs. Most, but not all, of the PEO clients were enrolled through the outreach efforts from their PEOs. The sample size of PEO clients is thus adequate for analysis purposes.(6) (Not all participants answered all questions, so sample sizes vary somewhat across measures.) The comparison (non-PEO client) group is smaller and was therefore used less frequently; only for those metrics for which no other external comparison data is available.
Comparison Groups and Specific Data Calculations
This section provides details about the definitions of the comparison groups and the exact calculations used for each of the metrics(7) described above in this paper, numbering the metrics from 1 to 9 for convenience.
ROI Calculations
As described above, the primary goal of this research initiative is to compare HR-related costs for PEO clients with costs in the same HR-related categories for organizations that do not use PEOs. For each of the cost categories being analyzed, we used the best available comparison group based on a combination of the following three factors: data comparability (to ensure “apples to apples”); large, reliable sample sizes from trustworthy sources; and the closest, most precise possible comparisons (across businesses or over time) for the businesses in our research sample.
By category, we used the following comparison groups and data calculations for purposes of analyzing each of the cost components that went into the cost savings ROI calculation:
1. Internal HR Salaries/Benefits
For this category, we compared the number of HR staff (measured per FTE) for PEO clients versus others, and monetized this number by multiplying it by the average cost (salaries and benefits) of HR professionals in small businesses. For this category, we were able to use high-quality external comparisons with large sample sizes: the large SHRM survey of businesses about their HR and human capital practices and expenditures(8) and Glassdoor salary data by job title for small businesses.(9) To calculate benefit costs based on average salary data, we used the most recent data from the Bureau of Labor Statistics.(10)
It should be noted that PEO clients are included in the SHRM data. Because PEO clients used, on average, fewer HR FTEs, their inclusion in this external comparison group thus makes the average number of HR FTEs in the comparison group slightly lower than it would have been if PEO clients had been able to be excluded. The actual difference between PEO clients and non-PEO clients is therefore a bit larger than the 1.0 HR FTEs estimate used in our ROI calculations (an additional factor that contributes to our ROI calculation being a conservative, lower-bound estimate).
2. Health Benefits Costs
The sample for this cost component was new PEO clients (with their PEO for two years or fewer) from the project enrollment data. We directly asked PEO clients on the enrollment form whether their health benefits costs were lower, about the same, or higher than before “because of your PEO,” and asked for the exact amount of the change attributable to the PEO. A total of 35 PEO clients who had been with their PEOs for two years or fewer(11) answered the first part, and 23 of those were able to provide the exact amount. We used those numbers to calculate savings on health benefits costs per FTE, with results yielding an average savings of $654 per FTE.(12)
3. Other HR-Related Expenditures
This component was calculated using internal data from this research project. It was not possible to find an appropriate external comparison group for HR-related expenditures (excluding internal benefits and salaries) because any external comparison would include PEO-related costs for any PEO clients in the sample. Therefore, we opted to calculate any savings in this area by using our project enrollment data from the PEO clients and organizations that do not use PEOs. Because those two samples had a number of important differences (most notably, the non-PEO sample has a larger number of average employees and includes a higher percentage of manufacturing companies), we did not compare the full set of each group. Instead, we created a comparison subset in which we identified the best single match for each business in the smaller non-PEO group.(13) Within this comparison group, PEO clients spend $7.46 less per month per FTE on other HR expenditures.(14)
4. Workers’ Compensation Costs
Like the health benefits comparison, the sample for this cost component was new PEO clients (with their PEO for two years or fewer) from the project enrollment data. We directly asked PEO clients on the enrollment form whether their workers’ compensation costs were lower, about the same, or higher than before they started using a PEO, and asked for an exact amount if available. A total of 23 PEO clients who had been with their PEOs for two years or fewer answered the first part, and 20 of those were able to provide the exact amount. We used those numbers to calculate savings on workers’ compensation costs per FTE, with results yielding an average savings of $66 per FTE.
5. Unemployment Insurance (UI) Costs Like the health benefits and workers’ compensation comparisons, the sample for this cost component was new PEO clients (with their PEOs for two years or fewer) from the project enrollment data. We directly asked PEO clients on the enrollment form whether their unemployment insurance costs were lower, about the same, or higher than before they started using a PEO, and asked for an exact amount if available. A total of 20 PEO clients who had been with their PEOs for two years or fewer answered the first part, but only one of those was able to provide the exact amount. Because a far higher percentage said their UI costs were lower than higher, we are confident there is some cost savings in this category, but are unable to determine the exact amount. We therefore included it as $0 in the ROI calculations.
Other comparison metrics
To complement analyses from previous years, we compared employee turnover, growth rates, and business challenges, while also examining reported changes in employee benefit offerings among new PEO clients. Additional details on the methodology used in these calculations is included below.
6. Employee Turnover
Based on data provided by organizations in the enrollment process, we calculated annual rates of voluntary and involuntary employee turnover for all organizations that had been PEO clients for at least one year (a total of 110 organizations). We compared these rates to national rates provided by the Bureau of Labor Statistics.(15) Because the national sample includes PEO clients as well, the calculated difference represents a slight underestimate.
7. Growth Rates
We used data from the survey enrollment process to calculate average growth rates. For growth in number of employees, we used reported total employment in 2019 and compared it with reported total employment in 2018. The PEO group included only those organizations that had used a PEO for one year or more (to ensure that we were measuring growth only for those that had actually been using a PEO when the measured growth period started). This included 110 organizations. We calculated the average for the PEO group and compared it to the average for those organizations that do not use a PEO (41 organizations with data available). For expected growth in business revenues, we used a question that directly asked respondents how they expected their revenues to change from 2018 to 2019 and calculated the average for each group. In both cases, we found similar results both for the entire research sample and for the more comparable “matched” comparison groups as described in measure #3 above.
8. Concerns About Employee Challenges
Responses from all 176 participants were used in this analysis. Respondents to the survey enrollment form were asked to select all business challenges (from a list of 17 different challenges) that they currently view as a “moderate or major concern” for their businesses. The only challenges selected by more than half of all respondents were three directly related to employees. (Other challenges included on the list were items such as increasing profits, compliance risk, business competitors, retaining customers, etc.) Similar results were seen in the more comparable smaller “matched” comparison groups. Differences for most of the less-frequently-selected business challenges were notably smaller between the comparison groups.
9. Employee Benefits Added by New PEO Clients
The sample of 19 organizations that had become PEO clients in the last 12 months were asked what employee benefits they had offered before starting work with a PEO and what employee benefits they currently offer. Eight of the nine benefits listed had been added by at least one new PEO client (almost no benefit categories were withdrawn by any new clients), with life insurance added by 42 percent of the new clients, followed by health benefits and retirement plans (26 percent added each).
About McBassi & Company
McBassi is an independent analytics and research firm that helps clients create consistently profitable and enlightened workplaces. McBassi uses the language and tools of business—metrics and analysis—to build successful organizations by optimizing the power of their people. McBassi’s principals (Dr. Laurie Bassi and Dan McMurrer) are co-authors of “Good Company: Business Success in the Worthiness Era” (winner of the 2012 Nautilus Gold Award for Business/Leadership) and the “HR Analytics Handbook.”
About the Authors
Dr. Laurie Bassi is CEO of McBassi and a global leader in the field of applying analytics in the world of HR. Bassi is the author of more than 90 published papers and books and was previously a tenured professor of economics and public policy at Georgetown University. She holds a Ph.D. in economics from Princeton University. Dan McMurrer is the chief analyst at McBassi. An analytics expert, McMurrer focuses on researching the relationship between organizations’ work and learning environments and their business results. He holds an M.P.P. in public policy from Georgetown University.
About NAPEO
The National Association of Professional Employer Organizations (NAPEO) is The Voice of the PEO IndustryTM and represents about 85 percent of the industry’s estimated $136 to $152 billion in gross revenues. NAPEO has some 250 PEO members that provide payroll, benefits, and other HR services to between 156,000 and 180,000 businesses employing between 2.7 and 3.4 million people. An additional 200 companies that provide services to PEOs are associate members of NAPEO. For more information, please visit www.napeo.org.
References
- We are extremely grateful to the following PEOs and other partner organizations for their invaluable assistance in enrolling clients, members, and other organizations in this research initiative: ADP TotalSource, the U.S. Chamber of Commerce, Delta Administrative Services, The Employer Group, InfinitiHR, Landrum HR, Lyons HR, the National Marine Manufacturers Association, Paychex, Servant HR, Slavic401k, Staff One HR, and SWBC PEO. Without the generous assistance and hard work of these organizations, this research would not have been possible.
- Because these numbers are averages, they can vary significantly based on a wide variety of factors. Specifically, using a PEO results in average savings (per FTE) in the following categories: internal HR salaries/benefits $965; health benefits costs $654; other external HR expenditures $90; workers’ compensation costs $66. Although there are savings in unemployment insurance as well, we used a value of $0 for the ROI calculation due to data limitations that prevented pinpointing the exact amount of UI savings.
- It is possible some PEOs may offer temporary introductory health benefits rates to their newest clients. There was no indication of this in our data, however, as we found similar average differences in health benefits costs for the newest PEO clients (less than one year with PEO) and clients with longer durations. Although the data included in our calculations is for clients who have been with their PEOs for two years or fewer, the numbers would be similar (actually, they would reflect a somewhat higher level of savings) if the cutoff were set at five years instead of two years.
- As seen in Figure 1, roughly one-third of respondents said their UI costs were now lower and almost all others said UI costs were about the same. Because almost no respondents were able to provide data on the exact amount of change in that category, however, it is included as 0, although the actual value is almost certainly higher than that. This factor also contributes to our ROI estimate being a conservative, lower-bound estimate.
- We examined differences between PEO clients and others across a number of other measures as well (specifically, employee benefits, other less-frequent business challenges, executives’ time on HR, and profitability rates), but found no clear patterns in the results. Due to the need for comparable measures, we conducted most of the analyses using the enrollment data. We believe the small sample sizes and lack of strong comparability between the organizations in the PEO group and the non-PEO group contributed to lack of clarity in those results.
- It should be noted that the average business in the database (median of 34.0 FTEs) is somewhat larger than an average PEO client based on the median (23.2 WSEs) reported in the 2019 FROS report.
- Prior to analysis, the raw data submitted by organizations through the survey enrollment process was examined for validity. We verified organizations’ responses regarding whether they were PEO clients (and, if so, how long they had been clients) and identified invalid responses or significant outliers and excluded them from the analysis database. We also excluded from the non-PEO group any organizations that had recently been PEO clients (within the last two years).
- The average number of HR FTEs per 100 employees is 2.60, per Society for Human Resource Management, “2017 Human Capital Benchmarking Report,” December 2017. www.shrm.org/hr-today/trends-and-forecasting/research-and-surveys/Documents/2017-Human-Capital-Benchmarking.pdf. This number compares to 1.60 HR FTEs per 100 employees among organizations in our database that have been PEO clients for at least six months.
- Accessed data (last updated August 5, 2019) from www.glassdoor.com on average salary for human resources generalist ($50,751), human resources manager ($62,328), and human resources director ($85,444), using only businesses with 0 to 50 employees. We took the average of those three salaries, reasoning that a typical small business would employ a small HR staff that needs to play all three of those roles.
- Total benefit costs are approximately 45.8 percent of wages/salaries for civilian workers in the United States. www.bls.gov/news.release/ecec.htm. (June 2019 BLS data release, based on data from March 2019). Thus, the average total salary and benefit cost for one HR employee at a small business is $96,482 (average of the three salary categories above times 1.458).
- We focused on newer PEO clients because we would expect their cost comparisons to be both more accurate and more relevant than estimated differences from clients who have worked with PEOs for a longer period of time and therefore may have a less accurate basis for estimating current differences in costs.
- This sample size is relatively low because we used a strict definition of “new clients” (those with two years or fewer with their PEOs). It should be noted that if we had also included the next duration category (three to five years with their PEO) in these calculations, the sample size would have been approximately 50 percent higher and the average savings would have been a bit higher than the results reported for the fewer-than-two-years sample.
- “Matched” companies were required to be in the same industry category. Further, among those in the same industry, the closest match was selected based on which business in the comparison group had the closest number of employees (with a maximum difference of 50 percent). Businesses with no such counterpart were not included in the analysis.
- We explored a variety of different criteria for identifying comparison groups and found similar results for other matched PEO versus non-PEO comparison groups. PEO client and non-PEO client differences were still positive but were smaller for this metric when examined within the entire sample (i.e., before taking steps to ensure closer matches for comparison purposes).
- Bureau of Labor Statistics Job Openings and Labor Turnover Survey, annual separation rates 2018 (accessed August 2019): total separations at www.bls.gov/news.release/jolts.t16.htm and quits (voluntary turnover) at www.bls.gov/news.release/jolts.t18.htm.